How Uber Works — System Design Deep Dive
Deep dive into Uber's architecture: real-time matching, geospatial indexing, surge pricing, ETA calculation, and how they handle millions of rides daily.
2026-03-23ubergeospatialreal-timemicroservicesdistributed-systems
![]()
Opening: Three Seconds That Move a Continent
You tap Request. Your phone sends a payload a few hundred bytes wide: who you are, where you are (with uncertainty), which product you want (UberX, Comfort, XL…), and a fingerprint of your session. Within roughly one to three seconds—often under two on a healthy network—you see a driver’s name, vehicle, and an ETA. Behind that mundane UX is one of the largest real-time control systems on Earth: geospatial indexing over millions of moving nodes, dispatch optimization under hard latency SLOs, routing and traffic fusion, dynamic pricing, fraud and risk, payments and settlement, and regional failover when dependencies misbehave.
This article is a case study in how Uber’s engineering organization turned that impossible problem into a domain-oriented microservice fabric with well-known open-source footprints (H3, Jaeger, contributions around Kafka, Pinot, Flink, MySQL scaling patterns, and more). Numbers below are order-of-magnitude anchors drawn from public talks, engineering blogs, and industry reporting—Uber’s internal figures move every quarter, but the shapes (what breaks first, what must never break) are stable.
The scale that constrains every design choice
| Signal | Representative magnitude | Engineering consequence |
|---|---|---|
| Completed trips & deliveries (platform-wide) | Tens of millions per day | Every completion emits multiple events; idempotency and ledger correctness dominate |
| Countries / cities | 70+ countries, 10,000+ cities | Regulatory, payment, and mapping heterogeneity is permanent |
| Mobile clients | Hundreds of millions of installs | Long tails of old OS versions, flaky networks, and aggressive battery optimization |
| Peak write throughput on core pipelines | Millions of events/sec class during spikes | Kafka-style logging and stream processors are not optional |
| Online driver/rider state changes | Continuous GPS streams | Spatial indexes must update incrementally—not per-request table scans |
| Microservices (logical) | Hundreds to 1000+ named services in large SOA maps | Ownership, blast-radius control, and DOMA-style boundaries matter more than “more services” |
| Data platform messages | Trillions of messages class over multi-year Kafka deployments (public talks) | Multi-cluster, schema evolution, and replay are first-class |
How to read the numbers
Treat every absolute as a moving baseline. The point is not “is it exactly 23.4M trips?” but “is your design still sane at 10× this load?” If not, revisit spatial partitioning, async boundaries, and degradation.


1. The Scale of Uber — Numbers That Rewrite Intuition
Uber is not “an app.” It is a marketplace control plane layered on top of maps, payments, trust & safety, and local regulation. The product surface is simple; the failure surface is enormous.
1.1 Uber by the numbers (publicly anchored)
| Metric bucket | Example public anchors | Why architects care |
|---|---|---|
| Trips / day | Investor updates often cite ~20M+ trips/day platform-wide (Mobility + Delivery vary by quarter) | Drives idempotency keys, outbox patterns, and reconciliation jobs |
| MAPC / riders | ~150M+ monthly active platform consumers (historical ranges in filings) | Long-tail device fragmentation shapes API and push strategies |
| Drivers & couriers | ~6M+ quarterly active earners (historical) | Supply churn and incentive systems are data-intensive |
| Cities | 10,000+ | Surge polygons, local rules, and map freshness differ per metro |
| Engineering headcount | Thousands of engineers across product infra | DOMA ownership and internal platforms (routing, ML, data) amortize cost |
| Microservices | Public architecture discussions reference hundreds of critical path services; org charts exceed 1000 logical services | Requires service mesh discipline, SLOs, and tiering |
| Kafka | Uber talks cite trillions of messages/year across data-plane Kafka | MirrorMaker / multi-region / schema registry are baseline |
| Peak request rates | Edge + API tiers see very high RPS during events; core dispatch loops target sub-second decision cycles | Timeouts, hedging, and circuit breaking are universal |
Throughput without correctness is liability
At this scale, duplicate events (at-least-once delivery) are normal. Your domain model must tolerate retries, replays, and split-brain windows unless you pay for strong cross-service transactions (you usually cannot).
1.2 End-to-end latency budget (why 3 seconds is a hard constraint)
The rider only experiences one timer, but the server stitches dozens of internal steps. A back-of-the-envelope for an on-demand match in a dense city might look like:
| Phase | p50 (ms) | p99 (ms) | Notes |
|---|---|---|---|
| TLS + API Gateway | 5–15 | 40–80 | Includes auth token validation |
| demand-svc persistence | 10–25 | 80–150 | Idempotent insert + outbox |
| geo-index lookup | 5–15 | 50–120 | Hot buckets cached in memory |
| routing batch ETA | 30–120 | 250–600 | Dominates when candidate set is large |
| scoring + fairness | 5–20 | 40–100 | CPU-light vs routing |
| offer fan-out + push | 20–80 | 150–400 | APNs/FCM tails are ugly |
| client animation | 10–30 | 50–100 | Not server-side, but steals perceived SLO |
Nothing here is “free.” If routing p99 slips by 200 ms, you consume the entire budget for reoffer rounds—so dispatch systems pre-trim candidates aggressively and cache segment speeds.
1.3 Infrastructure footprint: hybrid reality
Uber runs a hybrid footprint: owned data centers plus public cloud capacity, regionally distributed, with active-active ambitions for the most critical domains. The exact split is operationally sensitive, but the pattern is universal:
| Layer | Typical pattern | Uber-relevant notes |
|---|---|---|
| Edge / API | Anycast DNS, CDNs, regional API gateways | Mobile APIs are versioned for years; deprecation is expensive |
| Compute | Container orchestration at huge cluster scale | Bin-packing, autoscaling on custom metrics (queue depth, match latency) |
| Service mesh / RPC | gRPC + Envoy-style proxies (industry standard; Uber migrated off older stacks over time) | Load balancing must be L7-aware for retries |
| Data | Sharded MySQL (Schemaless), Cassandra, Redis, Kafka, Pinot, Hudi, object storage | Polyglot persistence is intentional—no single DB wins |
flowchart TB
  subgraph Mobile["Mobile clients"]
    R[Rider app]
    D[Driver app]
  end
  subgraph Edge["Edge & API tier"]
    DNS[DNS / Anycast]
    GW[API Gateway\nauth, rate limits]
  end
  subgraph Region["Regional control plane"]
    DIS[dispatch-core]
    RT[routing + traffic]
    PR[pricing]
    PY[payments / risk]
    GS[geospatial index svc]
  end
  subgraph Data["Data planes"]
    K[Kafka clusters]
    DB[(OLTP: MySQL / Schemaless)]
    CA[(Cassandra wide-column)]
    RD[(Redis cache + pubsub)]
    OLAP[(Pinot / OLAP)]
  end
  R --> DNS --> GW
  D --> DNS --> GW
  GW --> DIS
  GW --> RT
  GW --> PR
  DIS --> GS
  DIS --> RT
  DIS --> K
  RT --> K
  PR --> K
  PY --> DB
K --> OLAP2. Uber's Architecture Evolution — Monolith to DOMA
Uber’s trajectory mirrors every hypergrowth company—except the spatial and economic coupling is tighter, so mistakes become visible on a heatmap within minutes.
2010–2012: Python monolith — speed over structure
Early Uber optimized for velocity: a Python monolith, PostgreSQL, and Google Maps. That stack shipped the MVP and proved demand. The monolith’s simplicity was a feature—until concurrency, schema contention, and release coordination became the bottleneck. The lesson: monoliths win 0→1; they lose 1→N when teams step on each other’s schemas and deploy trains grow fragile.
2013–2016: Service-oriented architecture (SOA) — extract by pain
Uber split the monolith into services aligned to scaling pain: dispatch, maps, payments, surge, notifications. This era introduced Node.js for high I/O services and deeper Java/Go for heavy backend paths. The lesson: early SOA is often “services by database”—still better than a single global lock, but you inherit distributed transactions problems immediately.
2016–present: Domain-Oriented Microservice Architecture (DOMA)
Uber formalized DOMA: organize services as domains, layers, and gateways to manage the O(n²) integration problem. Instead of ad-hoc RPC spaghetti, product engineering consumes stable gateway APIs while domain teams evolve internals. Public posts describe collection layers, extension points, and avoiding “hard” dependencies across product lines (Rides, Eats, Freight). The lesson: microservices are not the goal—clear ownership and composable contracts are.
flowchart LR
  M[Monolith\nPython + Postgres] --> S[SOA\nextract hot paths]
  S --> D[DOMA\nDomains + Gateways\n+ extension layers]
  style M fill:#f8d7da
  style S fill:#fff3cd
style D fill:#d4edda2.1 DOMA in one paragraph
DOMA pushes teams to define domain boundaries that match business capabilities (matching, pricing, identity, payments), expose versioned APIs via gateways, and isolate experimental extensions so product lines can reuse platforms without forking them. Practically, that means fewer blocking calls across domains, more event-driven integration, and SLO-tiered dependencies (Tier-0 payment paths differ from Tier-2 recommendation features).
| Era | Primary win | Primary tax | Mitigation |
|---|---|---|---|
| Monolith | Fast iteration | Coupled deploys / schema fights | Modularize inside monolith until extract is obvious |
| SOA | Independent scale | RPC fan-out, fragile chains | Bulkheads, timeouts, idempotency, gateways |
| DOMA | Composable platforms | Governance overhead | Strong schemas, linters, service templates |
Interview framing: why DOMA exists
When interviewers ask “microservices vs monolith,” answer with integration complexity: at Uber-scale, the problem is not deployment units—it is managing dependency graphs. DOMA is a human scalability pattern first.
3. High-Level Architecture — The Microservice Landscape
No public diagram lists every production service—nor should it. What is stable is the capability map: a few Tier-0 paths (safety, payments, trip state) and many Tier-1/2 enrichments (recommendations, incentives UI, support tooling).
3.1 Representative service map (20+ logical services)
| # | Logical service / capability | Role in ride lifecycle |
|---|---|---|
| 1 | API Gateway / Edge | AuthN/Z, device attestation hooks, rate limits, routing |
| 2 | Session / Identity | Accounts, tokens, fraud signals at login |
| 3 | Rider profile | Preferences, business profiles, compliance |
| 4 | Driver profile / onboarding | Documents, background checks, vehicle records |
| 5 | Geospatial index | H3/S2-style partitions, online driver buckets |
| 6 | Supply service | Driver state machine: online/offline/busy |
| 7 | Demand service | Trip requests, cancellations, waitlists |
| 8 | Dispatch core | Matching, rematching, timeouts |
| 9 | Routing engine | ETA, distance matrices, polyline generation |
| 10 | Traffic service | Probe ingestion, segment speeds, closures |
| 11 | Surge / dynamic pricing | Multiplier computation, caps, regional policy |
| 12 | Fare engine | Upfront fare, time+distance, tolls, fees, currency |
| 13 | Payments orchestration | Tokenization, auth/capture, retries |
| 14 | Risk / fraud | Velocity rules, ML scores, step-up challenges |
| 15 | Ledger / accounting | Driver payouts, marketplace fees |
| 16 | Notifications | Push (APNs/FCM), SMS, email |
| 17 | Realtime gateway | WebSocket fan-out for live trip UI |
| 18 | Maps & tiles | Basemap, snap-to-road helpers (client + server) |
| 19 | Support / triage | Incident tooling, chatbots |
| 20 | Compliance | Data residency, audit trails, regulatory exports |
| 21 | Experimentation | Feature flags, A/B pricing experiments |
| 22 | Data ingestion | Kafka producers, schema registry clients |
3.2 RPC evolution: TChannel → gRPC (+ Envoy)
Uber historically invested in TChannel / Thrift-style RPC stacks for internal performance. The industry converged on gRPC + HTTP/2 and Envoy-class sidecars for retry budgets, outlier detection, and per-route timeouts. The architectural invariant: synchronous RPC must be bounded—every hop needs deadlines propagated on the wire.
| Concern | Without mesh discipline | With mesh + standards |
|---|---|---|
| Retries | Retry storms amplify outages | Limited retries + idempotency keys |
| Timeouts | Cascading latency piles up | Per-hop budgets + hedging only where safe |
| Observability | Log archaeology | Trace IDs (Jaeger lineage) + RED metrics |
flowchart TB
  subgraph Clients["Clients"]
    RA[Rider]
    DA[Driver]
  end
  subgraph Edge["Edge"]
    APIGW[API Gateway]
  end
  subgraph Core["Core domains"]
    DEM[demand-svc]
    SUP[supply-svc]
    GEO[geo-index-svc]
    DIS[dispatch-svc]
    RTE[routing-svc]
    SUR[surge-svc]
    FARE[fare-svc]
    PAY[payments-svc]
    RT[realtime-gw]
  end
  subgraph Async["Async bus"]
    K[Kafka]
  end
  RA --> APIGW
  DA --> APIGW
  APIGW --> DEM
  APIGW --> SUP
  DIS --> GEO
  DIS --> RTE
  DIS --> SUR
  DEM --> DIS
  SUP --> GEO
  FARE --> SUR
  FARE --> RTE
  PAY --> K
  DIS --> K
  RT --> RA
RT --> DAThe "matching service" is not one loop
Production dispatch is a constellation: supply freshness, ETA precomputes, batch optimizers, fairness constraints, and reoffer logic after timeouts. Interview answers should show state machines + retries, not a single greedy function.
4. The Ride Lifecycle — Step by Step
4.1 Request creation
- Client validation — product available in market, payment method present, location permissions sane.
- Eligibility — business rules, age, region locks.
- Fraud / risk pre-checks — velocity on device, account history, chargeback risk.
- Geohash/H3 bucketing — attach request to spatial partition for dispatch.
- Persist intent — create trip request record with idempotency key (network retries are guaranteed).
4.2 Driver matching (dispatch)
Dispatch pulls candidate drivers from the spatial index, ranks by ETA and fairness, sends offers, handles accept/timeout, and may reoffer with backoff. Pooling adds combinatorial constraints.
4.3 Navigation and routing
Once matched, both apps need consistent ETAs and routes. The server computes authoritative ETAs for pricing and SLA; clients may use on-device navigation SDKs for turn-by-turn while periodically reconciling.
4.4 Trip tracking
High-frequency GPS is sampled, map-matched, and streamed through the realtime gateway. Riders see live location; dispatch sees updated ETAs.
4.5 Completion, fare, payment
On dropoff, the fare engine closes the trip: distance/time reconciliation, tolls, surge application, promotions, then capture against the payment instrument.
4.6 Ratings and feedback
Post-trip events update two-sided reputation systems and feed trust models—often asynchronously to keep completion latency tight.
sequenceDiagram
  participant R as Rider app
  participant G as API Gateway
  participant D as demand-svc
  participant X as dispatch-svc
  participant S as supply-svc
  participant Q as geo-index
  participant T as routing-svc
  participant P as payments-svc
  participant K as Kafka
  R->>G: POST /requests (idempotent)
  G->>D: createRequest()
  D->>K: TripRequested
  D->>X: scheduleMatching(tripId)
  X->>Q: queryCandidates(H3, filters)
  Q-->>X: driver ids + coarse locs
  X->>T: batchETA(drivers, pickup)
  T-->>X: eta matrix
  X->>S: sendOffer(driverA)
  S-->>R: push + WS update
  R-->>G: driver accepted (client poll/WS)
  G-->>R: trip object
  Note over R,P: During trip: location ticks, reroutes, surge updates
  R->>G: completeTrip()
  G->>P: captureFare()
P->>K: PaymentCapturedstateDiagram-v2
[*] --> REQUESTED
REQUESTED --> MATCHING: persist + enqueue
MATCHING --> ACCEPTED: driver accepts
MATCHING --> CANCELLED: rider/driver/system
ACCEPTED --> EN_ROUTE: driver started
EN_ROUTE --> ARRIVED: at pickup
ARRIVED --> ON_TRIP: rider on board
ON_TRIP --> COMPLETED: dropoff
COMPLETED --> SETTLED: fare finalized
SETTLED --> [*]
ON_TRIP --> CANCELLED: mid-trip cancel policy| Stage | Typical p50 server time budget | Failure mode | User-visible fallback |
|---|---|---|---|
| Create request | tens of ms | DB hot shard | Retry with same idempotency key |
| Match | hundreds of ms | routing deg | Widen search ring, relax pool constraints |
| Trip updates | continuous | WS drop | Poll + push rebind |
| Pay | hundreds of ms | processor outage | Queue capture, show “processing” |
Idempotency keys are product features
Treat Idempotency-Key like a primary key for intent. Riders double-tap; networks duplicate POSTs. Without it, you create ghost trips and double charges—both are existential incidents.
5. Geospatial Indexing — The Heart of Uber
Naive approaches—“SELECT * FROM drivers WHERE distance < 2km”—die immediately:
| Approach | Complexity | Why it fails at Uber scale |
|---|---|---|
| Full scan | O(n) per request | n = online drivers in metro → CPU meltdown |
| Single giant geohash | Hot spots | Uneven partitions; thundering herds |
| Uncached spatial joins | DB-bound | OLTP path cannot absorb spatial join storms |
5.1 Google S2 geometry (deep dive)
S2 partitions the sphere into hierarchical quadrilateral cells (a space-filling curve aids locality). Each cell has a 64-bit ID, levels 0–30, and supports fast containment tests and region covering.
| Concept | Meaning | Operational use |
|---|---|---|
| Cell | Compact region on Earth’s surface | Bucket keys for drivers |
| Level | Finer cells at higher levels | Tune precision vs cardinality |
| S2RegionCoverer | Approximates polygons with cells | Surge polygons, geofences, airport shapes |
| Cap / polygon queries | “What cells intersect this region?” | Demand heatmaps |
Hilbert curve ordering means geographically close points often share nearby cell IDs, helping memory locality in indexes (though not perfectly—poles and edges need care).
flowchart TB
  E[Earth sphere] --> L0[Coarse cells\nlow level]
  L0 --> L1[Subdivide\nhigher level]
  L1 --> L2[Finer cells\nmany children]
L2 --> Q[Point query:\nlocate leaf cell]5.2 Uber H3 (hexagonal hierarchical index)
H3 is Uber’s open-source hexagonal grid. Key properties:
| Property | Benefit |
|---|---|
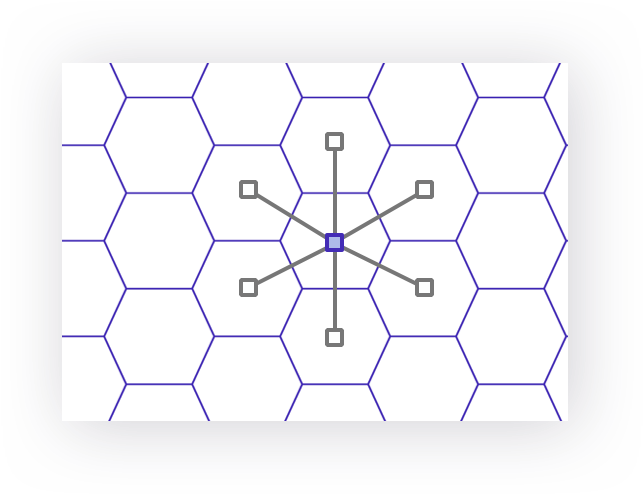
| Uniform adjacency | 6 neighbors (except pentagon artifacts) → predictable k-ring expansion |
| Hierarchical | Resolutions 0–15 from continent-scale to sub-meter class |
| Stable IDs | Integer / string cell IDs suitable for Kafka keys and Redis sharding |
k-ring expansion grows search radius in discrete steps—critical for dispatch’s “widen search if no takers” logic.
| Resolution (indicative) | Edge length (ballpark) | Typical use |
|---|---|---|
| 7 | ~1.2 km | City-scale aggregation |
| 8 | ~460 m | Neighborhood dispatch |
| 9 | ~174 m | Dense urban refinement |
| 10 | ~66 m | Fine-grained heatmaps |
Pentagons are real
H3’s icosahedron construction introduces pentagon cells with different topology. Production systems must unit test neighbor iteration around known pentagon locations—bugs here cause missed candidates.
5.3 H3 vs S2 vs Geohash vs R-tree vs Quadtree
| Index | Shape | Hierarchy | Distance / neighbor ops | Great for | Weakness |
|---|---|---|---|---|---|
| H3 | Hexagons | Yes | k-ring | Even expansion, aggregation | Pentagonal edge cases |
| S2 | Quads on sphere | Yes | Cell containment | Polygons, caps | Square adjacency less uniform |
| Geohash | Rectangles | Z-order string | Prefix scans | Simple KV stores | Edge distortion, “seam” issues |
| R-tree | Arbitrary rects | Balanced tree | Window queries | Dynamic rectangles | High write churn cost |
| Quadtree | Recursive squares | Tree | Local density | Games/sim | Distributed sharding harder |
5.4 Java: grid-based spatial index (compilable sketch)
This is a pedagogical implementation—production adds sharding, WAL, epoch GC, and lock-free structures. It compiles standalone and shows the cell → bucket → candidate pattern.
// SpatialGridIndex.java — javac SpatialGridIndex.java && java SpatialGridIndex
import java.util.*;
import java.util.concurrent.ConcurrentHashMap;

/** Fixed grid in degrees (demo only — production uses H3/S2 IDs as keys). */
public final class SpatialGridIndex {

    private final double cellDegreesLat;
    private final double cellDegreesLng;
    private final Map<Long, Set<String>> cellToDrivers = new ConcurrentHashMap<>();

    public SpatialGridIndex(double cellDegreesLat, double cellDegreesLng) {
        this.cellDegreesLat = cellDegreesLat;
        this.cellDegreesLng = cellDegreesLng;
    }

    public static long cellId(double lat, double lng, double dLat, double dLng) {
        int gy = (int) Math.floor(lat / dLat);
        int gx = (int) Math.floor(lng / dLng);
        return ((long) gy << 32) | (gx & 0xffffffffL);
    }

    public void upsertDriver(String driverId, double lat, double lng) {
        long id = cellId(lat, lng, cellDegreesLat, cellDegreesLng);
        cellToDrivers.computeIfAbsent(id, k -> ConcurrentHashMap.newKeySet()).add(driverId);
    }

    public void removeDriver(String driverId, double lat, double lng) {
        long id = cellId(lat, lng, cellDegreesLat, cellDegreesLng);
        Set<String> bucket = cellToDrivers.get(id);
        if (bucket != null) {
            bucket.remove(driverId);
            if (bucket.isEmpty()) {
                cellToDrivers.remove(id, bucket);
            }
        }
    }

    /** Naive neighbor search: origin cell + 8 adjacent grid steps (3×3). */
    public Set<String> nearby(double lat, double lng) {
        int gy = (int) Math.floor(lat / cellDegreesLat);
        int gx = (int) Math.floor(lng / cellDegreesLng);
        Set<String> out = new HashSet<>();
        for (int dy = -1; dy <= 1; dy++) {
            for (int dx = -1; dx <= 1; dx++) {
                long id = ((long) (gy + dy) << 32) | (((long) (gx + dx)) & 0xffffffffL);
                Set<String> b = cellToDrivers.get(id);
                if (b != null) {
                    out.addAll(b);
                }
            }
        }
        return out;
    }

    public static void main(String[] args) {
        SpatialGridIndex idx = new SpatialGridIndex(0.01, 0.01);
        idx.upsertDriver("d1", 37.77, -122.42);
        idx.upsertDriver("d2", 37.771, -122.421);
        System.out.println(idx.nearby(37.77, -122.42));
    }
}
5.5 Millions of location updates per second
| Technique | Role |
|---|---|
| Coalescing | Drop intermediate ticks; keep latest per driver per 200–500ms window |
| Local aggregation | Edge nodes summarize before cross-region fan-in |
| Partition by cell | Kafka topic keys = H3 cell at moderate resolution |
| In-memory primary | Redis / custom in-memory maps with durability async |
flowchart LR
  GPS["lat/lng + accuracy"] --> CELL["cellId = H3 index at resolution"]
  CELL --> BKT[fetch bucket drivers]
  BKT --> FILT[hard filters\nvehicle, product, ban-list]
  FILT --> RANK[ETA + fairness score]
RANK --> OFFR[send offers]6. The Dispatch System — Driver Matching
Dispatch is a continuous optimization problem disguised as an API.
6.1 Supply positioning and demand prediction
| Input | Source | Use |
|---|---|---|
| Live driver cells | geo-index | Candidate generation |
| Historical demand | OLAP (Pinot-like) | Prepositioning incentives |
| Events / weather | External feeds | Surge pre-warming |
6.2 Candidate generation
- H3 k-ring around pickup at resolution tuned to density.
- Filter: product match, document validity, cooldown from prior declines.
- Cap to top-N before expensive ETA matrix calls.
6.3 ETA-based ranking
ETA dominates rider UX; it is the primary score before tie-breakers (fairness, idle time, quality).
6.4 Batch vs greedy
| Strategy | Latency | Quality | When used |
|---|---|---|---|
| Greedy | lowest | local optimum | dense cities with abundant supply |
| Mini-batch | higher | better global fit | constrained supply, pools, airport queues |
| Re-solve on tick | continuous | tracks movement | long pickup distances |
6.5 Fairness and anti-gaming
| Problem | Mitigation sketch |
|---|---|
| Cherry-picking | Throttle repeated cancels; quality scores |
| Surge chasing | Streak bonuses decoupled from short-hop gaming |
| Synthetic scarcity | Anomaly detection on driver collusion patterns |
6.6 Scheduled vs on-demand
Scheduled rides shift time constraints into optimization windows—dispatch pre-commits capacity closer to pickup time while sending reminder pushes.
6.7 Pool / shared rides
Pooling introduces pickup order and delay constraints for each rider. The optimizer minimizes total vehicle-minutes subject to SLA caps.
flowchart TB
  A[New trip request] --> B[spatial candidates]
  B --> C[batch ETA]
  C --> D[score + fairness tie-break]
  D --> E[send top-K offers]
  E --> F{accept in T seconds?}
  F -- yes --> G[bind trip]
  F -- no --> H[widen k-ring / adjust surge]
H --> Bflowchart LR
V[Vehicle] --> P1[Pickup A]
P1 --> P2[Pickup B]
P2 --> D1[Dropoff A]
D1 --> D2[Dropoff B]6.8 Batch ETA as a linear algebra mindset
When N drivers meet M trip offers (pooling, chained pickups), you conceptually build a cost matrix C[i][j] (ETA or earnings-adjusted ETA). Exact assignment is assignment problem / min-cost matching territory—Hungarian algorithm in O(n³) for dense matrices. Production systems rarely solve full global optima on every tick; they window the problem (top-K drivers × active trips) and warm-start from the previous second’s solution.
| Formulation | Complexity | When it is worth it |
|---|---|---|
| Greedy min-ETA | O(N log N) sort | Dense supply, tight latency SLO |
| Min-cost matching (small window) | O(k³) for k×k window | Airport queues, pool batches |
| Column generation / heuristics | Varies | Very large k with structure |
Interview upgrade path
Start greedy. Then say: “If the business requires global fairness or pool optimality, I’d cap k with spatial filters, then run min-cost matching on the cap.” That signals you know OR tools without pretending the whole planet fits in one matrix.
6.9 Java: greedy ETA matcher (compilable)
// GreedyDispatchMatcher.java — compile with SpatialGridIndex in same dir or adjust packages
import java.util.*;

public final class GreedyDispatchMatcher {

    public record Driver(String id, double lat, double lng, double etaMinutes) {}

    public Optional<Driver> pickBest(Collection<Driver> candidates) {
        return candidates.stream().min(Comparator.comparingDouble(Driver::etaMinutes));
    }

    public static void main(String[] args) {
        var m = new GreedyDispatchMatcher();
        List<Driver> c = List.of(
            new Driver("a", 0, 0, 4.2),
            new Driver("b", 0, 0, 3.1),
            new Driver("c", 0, 0, 5.0)
        );
        System.out.println(m.pickBest(c));
    }
}
Greedy is a baseline, not the product
Interview answers should mention constraints: SLA, pool order, driver starvation, and timeouts. Greedy demos fit in a whiteboard; production adds reoptimization after each GPS tick.
7. ETA Calculation — Deep Dive
7.1 Road graph
Digital maps become a weighted directed graph: nodes are topology points; edges are road segments with distance, speed priors, turn penalties, and access rules.
| Representation | Trade-off |
|---|---|
| OpenStreetMap-derived | Great for community updates |
| Proprietary fusion | Higher trust for routing |
7.2 Algorithms
| Algorithm | Complexity | Use |
|---|---|---|
| Dijkstra | O(E + V log V) | Baseline SSSP |
| A* | Faster with heuristic | Interactive routing |
| Contraction Hierarchies | Preprocess heavy, query fast | Production-scale queries |
| Custom ML overlays | Learn residual errors | Last-mile calibration |
flowchart TB
  G[Road graph\nCH / CRP / custom] --> Q[Shortest path query]
  T[Live segment speeds] --> F[Fuse weights]
  Q --> F
  F --> B[Base ETA]
  M[ML calibration] --> E[Displayed ETA]
B --> M7.3 Map matching
GPS error clouds snap to polylines using hidden Markov or particle methods. Bad snapping skews distance and breaks surge borders.
7.4 Real-time traffic
| Stage | Detail |
|---|---|
| Probe ingestion | Driver phones report speeds (privacy-preserving aggregation) |
| Segment speed | Robust estimators drop outliers |
| Prediction | Short-horizon models for arteries |
flowchart LR
  P[Probes stream] --> A[map-match to segments]
  A --> S[speed estimator]
  S --> U[update edge weights]
U --> R[routing queries see new costs]7.5 ML calibration and fallbacks
When routing degrades (map incident, partial outage), fall back to haversine bounds, historical priors, and wider confidence intervals on the UI. Never silently promise impossible precision.
ETA errors are financial instruments
Upfront fares depend on predicted route minutes. Systematic underprediction angers riders; overprediction angers drivers. Calibration is a P&L problem, not only ML accuracy.
8. Surge Pricing (Dynamic Pricing)
8.1 Economics
Surge is a price signal to balance marginal supply and demand. In control-theory terms, it’s a feedback loop with human actors—latency and transparency shape stability.
8.2 Computing multipliers
| Factor | Role |
|---|---|
| Local imbalance | Shortage in H3 polygon vs rolling baseline |
| Elasticity models | How demand responds to price |
| Caps / floors | Regulatory and UX guardrails |
flowchart LR
  D[Demand intensity] --> I[Imbalance metric]
  S[Supply availability] --> I
  I --> M[Multiplier function]
  M --> R[Rider price]
M --> V[Driver incentives]8.3 Geofencing and temporal patterns
Airports, stadiums, and weather spikes produce sharp local gradients. Systems pre-materialize geofence metadata to avoid recomputing polygons on the hot path.
8.4 Anti-gaming and regulation
| Risk | Mitigation |
|---|---|
| Collusion | Statistical tests on coordinated offline events |
| Regulatory caps | Jurisdiction-specific policy tables |
| Transparency | Show multipliers; audit logs |
8.5 Upfront vs time-and-distance
Upfront pricing fixes rider exposure but shifts risk to prediction error models—ties directly back to Section 7.
flowchart TB
  TE[Telemetry] --> Z[Zone imbalance]
  Z --> POL[Policy engine\njurisdiction rules]
  POL --> FE[Fare engine]
  FE --> UI[Client display]
Pricing is a control system, not a spreadsheet
If your multiplier reacts too quickly, you oscillate (hunting). Too slowly, you waste supply. Production systems apply smoothing, hysteresis, and separate rider vs driver incentive channels.
9. Payment System — Deep Dive
9.1 Fare calculation
| Component | Notes |
|---|---|
| Base fare | Market-specific |
| Time + distance | From routed polyline + clock |
| Surge | Applied per policy |
| Tolls | Map + provider feeds |
| Fees | Airport, booking, service |
| Promotions | Ledgered carefully to avoid double-spend |
9.2 Methods by region
| Region pattern | Instruments |
|---|---|
| US / EU | Cards, Apple Pay, PayPal |
| India | UPI, wallets |
| LATAM / Africa | Cash-heavy markets, local rails |
9.3 Auth hold and capture
Authorization reserves funds; capture happens on completion (or cancellation rules). Idempotent captures prevent duplicate charges on retries.
9.4 Fraud detection
| Layer | Example signals |
|---|---|
| Rules | Velocity, impossible travel |
| ML | Device graph, session embeddings |
| Step-up | 3DS, OTP |
sequenceDiagram
  participant C as Client
  participant P as payments-svc
  participant R as risk-svc
  participant PS as Processor
  C->>P: authorize(hold)
  P->>R: score()
  R-->>P: allow / challenge
  P->>PS: AUTH
  PS-->>P: auth code
  Note over C,PS: Trip runs...
  C->>P: capture(tripId)
  P->>PS: CAPTURE
PS-->>P: receiptflowchart TB
E[Event: add card / trip pay] --> R1[rules engine]
R1 --> R2[graph features]
R2 --> R3[ML model ensemble]
R3 --> DEC{Decision}
DEC -->|allow| OK[continue]
DEC -->|challenge| CH[3DS / OTP]
DEC -->|block| BL[hard decline + audit]9.5 Payouts, tips, promos, credits
Driver payouts batch through ledger systems with tax forms and instant pay options where supported. Tips flow as separate ledger lines. Promo codes require per-user caps and accounting segregation.
Money path is Tier-0
Degrade recommendations before you degrade authorization correctness. Payments need strong consistency within the financial boundary—often saga + outbox rather than naive “fire-and-forget Kafka.”
10. Real-Time Communication Infrastructure
10.1 WebSockets and alternatives
| Transport | Strength | Weakness |
|---|---|---|
| WebSocket | Duplex, low overhead | Stateful proxies, reconnect storms |
| SSE | Simple server push | One-way only |
| Long polling | Ubiquitous | Higher latency / cost |
flowchart TB
  D[Driver app] -->|GPS tick| GW[realtime-gw]
  GW -->|normalize| K[Kafka trip.topic]
  GW -->|fan-out| R[Rider subscriptions]
  subgraph Pool["Connection pool"]
    WS1[WS session]
    WS2[WS session]
  end
R --> Pool10.2 Push notifications
APNs/FCM carry collapse keys so the latest ETA replaces stale notifications.
sequenceDiagram
  participant S as trip-svc
  participant N as notify-svc
  participant F as FCM/APNs
  participant U as User device
  S->>N: TripStateChanged
  N->>F: send(token, payload)
F-->>U: display / data push10.3 Delivery guarantees and mobile unreliability
Assume at-least-once. Clients dedupe by (tripId, seq) or version fields. On reconnect, snapshot current trip state from an API—not from message backlog alone.
Backpressure is UX
If you blast every GPS point to riders, batteries die and routers melt. Coalesce on server; send meaningful deltas only.
11. Data Infrastructure
11.1 Kafka at Uber-scale
Public materials reference trillions of messages and thousands of topics. Operational necessities:
| Concern | Pattern |
|---|---|
| Multi-cluster | Regional clusters + mirroring |
| Schema registry | Evolve Avro/Protobuf safely |
| DLQ | Poison messages isolated with replay tooling |
| Quota | Tenant-level produce limits |
flowchart LR
  SVC[services] --> K[Kafka]
  K --> F[Flink jobs]
  K --> P[Pinot ingest]
  K --> H[Hudi lake]
F --> FE[features / alerts]11.2 Storage systems
| Store | Uber-flavored use |
|---|---|
| Schemaless | Sharded MySQL layer for massive OLTP |
| Cassandra | Wide-column for high-write timelines |
| Redis | Caching, rate limits, pub/sub |
| Pinot | Real-time OLAP dashboards |
| Hudi | Incremental lake ingestion |
11.3 Stream processing and ML platform
Apache Flink powers real-time aggregation; Michelangelo (Uber ML platform, public talks) covers training, feature stores, and serving—connecting Kafka features to online models for ETA, fraud, and demand forecasting.
flowchart TB
  LOG[Event logs] --> FT[Feature pipelines]
  FT --> TR[Trainer]
  TR --> REG[Model registry]
  REG --> SV[Online serving]
  RT[Realtime events] --> SV
SV --> PR[predictions back to services]Training/serving skew will burn you
If offline features differ subtly from online features, models lie confidently. Invest in shared feature definitions and shadow evaluation before promoting models.
11.4 Trust, safety, and privacy-aware telemetry
Uber-scale telemetry is both a product advantage (ETA, fraud) and a civil liberties surface (movement traces). Architecturally, the same patterns appear: purpose limitation, aggregation, retention tiers, and access auditing.
| Capability | Engineering pattern | Why it matters |
|---|---|---|
| Trip recordings | Encrypted at rest; strict ACLs; time-bounded retention policies | Minimizes blast radius of credential leaks |
| Real-time location | Coarse cells for analytics; finer precision only on hot path | Reduces re-identification risk in logs |
| Safety incidents | Dedicated workflows with immutable audit trails | Legal discovery and trust operations |
| DSAR / deletion | Event-sourced tombstones + downstream compaction jobs | GDPR-style rights at pipeline scale |
flowchart TB
  P[Phone GPS] --> E[Edge gateway]
  E --> H[H3 coarse cell\nfor analytics]
  E --> D[dispatch hot path\nfiner resolution]
  H --> K[Kafka aggregate topics]
D --> DIS[matching only]Safety features are Tier-0 dependencies
Emergency contacts, Share My Trip, and in-ride anomaly signals must survive partial outages. They often ride separate minimal service paths with higher replication factors than marketing banners.
12. Uber's Technology Stack
| Domain | Languages / runtimes | Notes |
|---|---|---|
| High-throughput services | Go, Java | GC tuning, low pause collectors |
| Data / ML | Python, Scala, Java | PyTorch/JVM interop patterns |
| Edge APIs | Node.js historically; polyglot now | I/O heavy paths |
| Mobile | Swift, Kotlin | Strong typing for networking layers |
12.1 Open-source footprint (sample)
| Project | Uber relation |
|---|---|
| H3 | Created; universal spatial index |
| Jaeger | Originated at Uber; distributed tracing |
| Peloton | Cluster scheduler (historical interest) |
| Kafka ecosystem | Heavy producer/consumer; internal tooling |
Trace IDs are the lingua franca
Adopt OpenTelemetry-compatible tracing early. At Uber/Jaeger scale, p99 tail debugging without traces is archaeology.
12.2 Schemaless in one paragraph (sharded MySQL done seriously)
Uber’s Schemaless layer (public engineering posts) is not “NoSQL in MySQL”—it is an orchestrated sharding approach with triggers, indexes, and workflows to scale wide rows and high-cardinality keys without turning every engineer into a DBA. Think application-level partitioning with consistent hashing, resharding playbooks, and online schema evolution guarded by automation.
| Feature | What it buys you | Operational cost |
|---|---|---|
| Hash-based sharding | Horizontal write scale | Cross-shard queries hurt—design around partition keys |
| Row-level versioning | Safer migrations | Compaction + GC jobs |
| Async indexing pipelines | Faster writes | Eventual consistency windows |
12.3 Framework and platform matrix (illustrative)
| Layer | Representative choices | Notes |
|---|---|---|
| RPC | gRPC, Protobuf | Strong typing across language boundaries |
| Mobile networking | OkHttp, Cronet, custom QUIC experiments | Retry policies must be coordinated with server idempotency |
| Maps | On-device nav SDKs + server authoritative ETAs | Split display vs billing responsibilities |
| CI/CD | Massive internal pipelines | Feature flags decouple deploy from release |
| Observability | Jaeger traces, metrics, structured logs | RED + USE per service minimum |
// BAD: O(n) — scans every online row per request
// SELECT driver_id FROM drivers WHERE ST_Distance(loc, ?) < 2000 AND online=1;
import java.util.ArrayList;
import java.util.List;

public final class NaiveSpatialQuery {
    public List<String> allWithinKm(List<DriverRow> table, double lat, double lng) {
        List<String> out = new ArrayList<>();
        for (DriverRow r : table) {
            if (haversineKm(lat, lng, r.lat, r.lng) < 2.0 && r.online) {
                out.add(r.id);
            }
        }
        return out;
    }
    private static double haversineKm(double lat1, double lon1, double lat2, double lon2) {
        final double earthKm = 6371.0;
        double dLat = Math.toRadians(lat2 - lat1);
        double dLon = Math.toRadians(lon2 - lon1);
        double a = Math.sin(dLat / 2) * Math.sin(dLat / 2)
                + Math.cos(Math.toRadians(lat1)) * Math.cos(Math.toRadians(lat2))
                * Math.sin(dLon / 2) * Math.sin(dLon / 2);
        double c = 2 * Math.atan2(Math.sqrt(a), Math.sqrt(1 - a));
        return earthKm * c;
    }
    private record DriverRow(String id, double lat, double lng, boolean online) {}
}
13. Reliability and Fault Tolerance
13.1 Multi-region
Active-active patterns require conflict resolution for trip state—leader regions per trip or CRDT-like constraints are common patterns in industry.
13.2 Circuit breakers and bulkheads
| Pattern | Purpose |
|---|---|
| Circuit breaker | Stop hammering sick deps |
| Bulkhead | Isolate thread pools / connection pools |
| Timeout + deadline | Cap queue buildup |
stateDiagram-v2
  [*] --> CLOSED
  CLOSED --> OPEN: error rate > threshold
  OPEN --> HALF_OPEN: after sleep window
  HALF_OPEN --> CLOSED: probe success
HALF_OPEN --> OPEN: probe failure13.3 Graceful degradation hierarchy
| May degrade | Must not degrade |
|---|---|
| Map refresh cadence | Safety incident reporting |
| Surge polygon granularity | Payment authorization correctness |
| Recommendation richness | Trip state transitions integrity |
flowchart TB
  R1[Region A] -->|failing SLO| DNS[Traffic shift]
  DNS --> R2[Region B]
R2 --> DB[(replicated data)]13.4 Chaos and SRE
GameDays inject latency, packet loss, and dependency failure to validate fallbacks. SRE practices align error budgets to feature velocity—matching Tier-0 services stricter budgets.
Degradation must be ethical and measurable
Never “fail open” on fraud or safety to save CPU. Degrade delight features first—and log when you do.
13.5 SLO starter pack and incident command
| Service tier | Example SLO | Error budget consumer |
|---|---|---|
| Tier-0 payments / trip state | 99.99% monthly availability | Freeze risky changes near budget exhaustion |
| Tier-1 dispatch / routing p95 | < 500 ms under normal load | Auto-rollbacks + paging |
| Tier-2 recommendations | 99.5% | Delay launches, not money movement |
flowchart LR
  A[Alert fires] --> B[Incident commander]
  B --> C[Mitigate: degrade / failover]
  C --> D[Status page + comms]
  D --> E[Postmortem]
E --> F[Action items: SLO + code + runbooks]| Role | Responsibility during sev-1 |
|---|---|
| IC | Single decision thread; stops thrash |
| Tech lead | Root-cause hypotheses; rollback vs hotfix |
| Comms | Rider/driver messaging; regulator-sensitive wording |
| SRE | Capacity, circuit breakers, traffic shifts |
13.6 Degradation ladder (explicit ordering)
| Stage | User-visible effect | Engineering action |
|---|---|---|
| 1 | Slightly stale map tiles | Serve CDN-cached tiles longer |
| 2 | ETA confidence bands widen | Show intervals; increase buffer in ranking |
| 3 | Surge updates less granular | Merge adjacent H3 cells for pricing |
| 4 | Disable pooled matching | Fall back to single-party offers |
| 5 | Read-only dashboards | Shed OLAP queries; protect OLTP |
flowchart TB
  OLAP[OLAP / BI queries] --> FEAT[Recommendations]
  FEAT --> SUR[Surge granularity]
  SUR --> RT[Realtime map polish]
  RT --> DIS[dispatch optimality]
  DIS --> PAY[Tier-0: payments + trip truth]
  style PAY fill:#d4edda
style OLAP fill:#f8d7da14. Lessons Learned and Key Takeaways
14.1 Patterns to steal
| Pattern | When to use | Uber example |
|---|---|---|
| Spatial partitioning | Any moving-asset marketplace | H3 cells + k-ring search |
| Idempotent command APIs | Mobile networks | Trip request keys |
| Event-first integration | Many producers/consumers | Kafka backbone |
| Gateway + domain modules | Many product lines | DOMA |
| ML calibration | Predictions affect money | ETA + upfront fare |
14.2 Common mistakes in ride-sharing design
| Mistake | Symptom | Fix |
|---|---|---|
| Single global driver table scan | DB meltdown at peak | Cell-partitioned index |
| Synchronous chains 8 hops deep | Tail latency explosions | Collapse with async + read models |
| No idempotency | Double trips/charges | Keys + dedupe store |
| Ignoring fairness | Driver churn | Explicit objectives in ranker |
14.3 Interview tips (Uber-style system design)
- Start with SLO: p95 match latency, consistency model for trip state.
- Draw spatial index before algorithms.
- Separate pricing, dispatch, and payments boundaries.
- Discuss failure: retries, circuit breakers, regional failover.
- Mention observability: metrics, logs, traces for dispatch loops.
14.4 Further reading (official / authoritative)
| Topic | Where to start | What you will learn |
|---|---|---|
| DOMA | Search Domain-Oriented Microservice Architecture on eng.uber.com | How to tame service integration graphs |
| Schemaless | Uber Engineering posts on Schemaless | MySQL sharding patterns at extreme scale |
| Michelangelo | Uber Engineering posts on Michelangelo | End-to-end ML platform concerns |
| H3 | h3geo.org + github.com/uber/h3 | API surface, resolutions, k-ring semantics |
| Jaeger | jaegertracing.io | Trace topology for microservices |
| Kafka operations | Uber Engineering + Confluent reference architectures | Multi-cluster, mirroring, replay |
| Dispatch intuition | Engineering posts mentioning dispatch, marketplace, matching | Offer timeouts, batching, fairness |
Additional entry points:
- Uber Engineering hub: https://eng.uber.com/ — filter by Infra, Data, AI, and Mobile tags
- Uber Open Source directory: https://opensource.uber.com/ — H3, Jaeger, and historical platform tools
14.5 Capacity planning thought experiment
Suppose a metro peaks at ~8k concurrent online drivers and ~15k open trip intents during a concert egress (illustrative). A 1 Hz location heartbeat (after coalescing) implies ~8k writes/s to the spatial index partition for that metro alone, before fan-out to dispatch consumers. If your design stores one giant row per city, you will serialise updates and die. If you partition by H3 cell at resolution 8–9, you spread writes across thousands of buckets—exactly the point of hierarchical spatial indexes.
| Knob | Too low | Too high |
|---|---|---|
| H3 resolution for bucketing | Massive hot buckets | Too many tiny buckets; memory overhead |
| Offer timeout | Drivers spammed with stale offers | Riders wait forever |
| ETA batch size | High RPC overhead | Slow ranking; stale decisions |
14.6 Glossary (quick scan)
| Term | Meaning here |
|---|---|
| k-ring | H3 cells within k steps on the hex grid |
| Surge | Dynamic multiplier balancing supply/demand |
| Schemaless | Uber’s sharded MySQL storage layer (not schema-free data) |
| DOMA | Domain-Oriented Microservice Architecture |
| CH | Contraction Hierarchies (routing preprocessing) |
| DLQ | Dead-letter queue for poison Kafka messages |
| SLO | Service level objective (target + window) |
| Tier-0 | Services where failure is unacceptable (payments, trip truth) |
14.7 Whiteboard drills (with expected talking points)
| Prompt | Draw first | Then add | Trap answer |
|---|---|---|---|
| Design Uber | H3/S2 cells on a map | dispatch loop + Kafka | “Just Redis GEOADD” without sharding story |
| Estimate Kafka throughput | Topics/partitions math | batching + compression | Ignoring consumer lag SLO |
| Surge pricing | Feedback loop diagram | caps + smoothing | Static multiplier table |
| Payments | Idempotent capture sequence | risk in parallel | Double charge on retry |
| Real-time map | WebSocket gateway | coalesced GPS | Per-tick DB updates |
14.8 Observability checklist (production-grade)
| Signal | Minimum viable | Uber-scale upgrade |
|---|---|---|
| Metrics | RED per service | Tail SLOs on dispatch stages |
| Logs | JSON + trace id | Sampled debug + PII scrubbing |
| Traces | Single gateway span | Full DAG across routing + pricing |
| Dashboards | RPS + errors | k-ring saturation, offer accept rate |
14.9 Regulatory and marketplace reality (non-optional context)
Architects ignore policy tables at their peril. Cities differ on cash, vehicle class caps, dynamic pricing disclosure, and data localization. The implementation pattern is not scattered if (city == "X") branches in every service—it is versioned configuration loaded into policy engines with audit trails, evaluated close to pricing and dispatch decisions.
| Concern | Engineering pattern |
|---|---|
| Price transparency | Immutable quote snapshots stored with trip |
| Driver classification | Document verification workflows + expiration timers |
| Data residency | Regional deployments + replication constraints |
flowchart TB
  T[Telemetry] --> POL[Policy engine\njurisdiction config]
  POL --> PR[pricing outputs]
  POL --> DS[dispatch constraints]
POL --> AUD[audit log]Epilogue: Why this problem stays fascinating
Uber’s stack is a living lesson that geometry + economics + mobile unreliability forces distributed systems to grow up fast. Build the indexes first, keep money paths boringly correct, and treat ETA as both UX and financial derivative. Do that, and you’ve earned the right to optimize the elegant details—batch matching, pooled routes, and the endless craft of fair marketplaces.